Our survey was open from 6th March 2024 to 26th April 2024 and we are extremely grateful to the 635 people who took the time to respond on behalf of their organisation this year.
The survey is designed for any not-for-profit organisations in the UK voluntary, charity and social enterprise sector at any stage with digital, although some questions are less relevant to very small organisations with no paid staff.
Every year, we work hard to make our survey representative of the huge range of organisations across the UK charity sector. We ask a range of questions about size, location, type of organisation, main target group and whether the organisation is led by specific population groups. In this section, we set out which groups responded and which didn’t.
About our sample
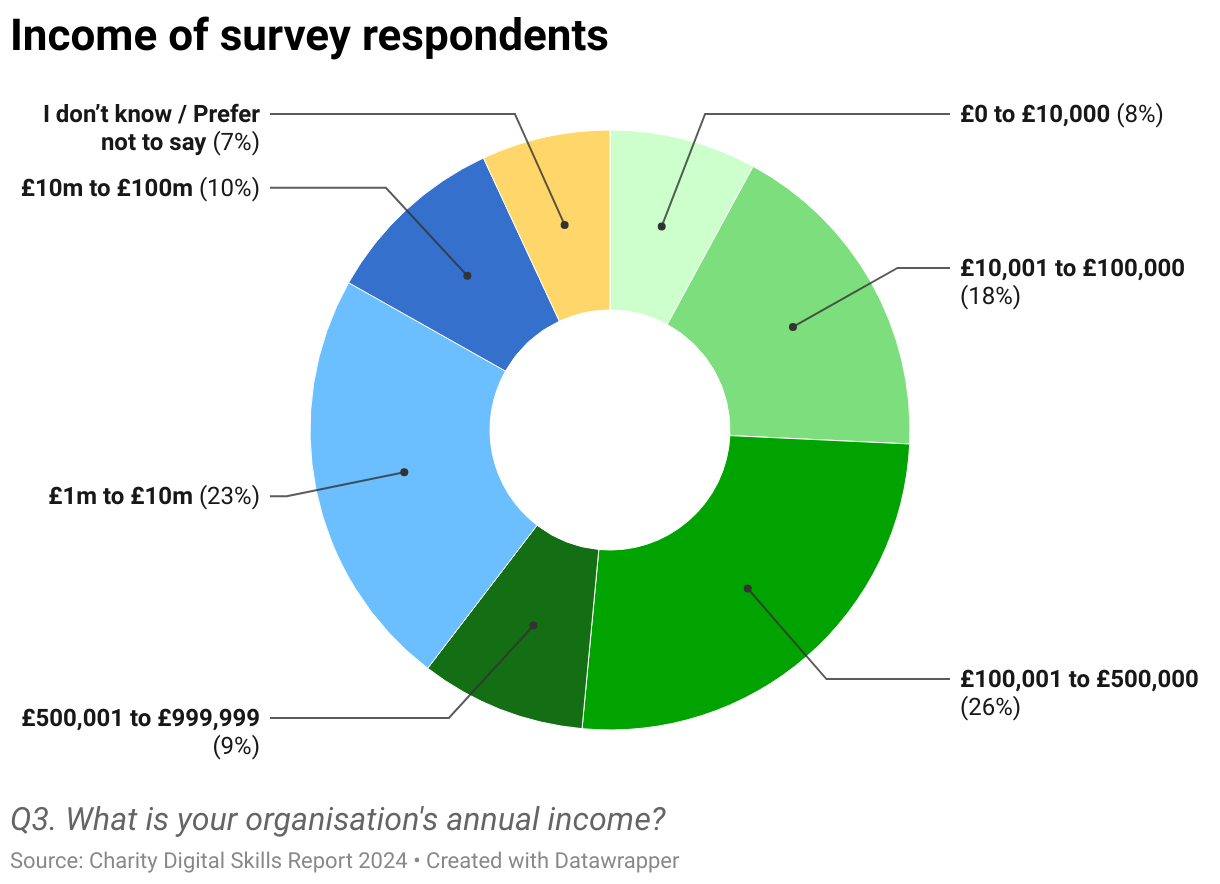
- Small charities: We have 385 responses from small charities (income less than £1m), representing 62% of our responses overall. Whilst this is a lower proportion than the 73% of small charities responding in 2023, we have a higher number of responses overall (385 in 2024, compared to 360 in 2023).
- Very small charities: Half (52%) of respondents have an income of less than £500,000. However, only 8% of respondents are from very small charities, with an annual income under £10,000. We do however specify that some questions in the survey are less relevant for very small organisations with no paid staff.
- Large charities: Large charities (annual income of more than £1m) represent 33%, or 206, of our responses. This is higher than the 23% last year.
- Different digital stages: 50% are early stage (compared to 52% in 2023 and 43% in 2022), whilst 50% are advanced or advancing (compared to 48% in 2023 and 56% in 2022).
- Organisations led by lived experience: 31% say they are led by people with lived experience of the issue they address.
- Infrastructure and funders: 9% are an infrastructure/second tier organisation, whilst 7% are a grantmaking trust or foundation.
- Different models:
- 81% are registered charities
- 17% describe themselves as a social enterprise or community business.
- Frontline services: Half (53%) provide frontline services to individuals.
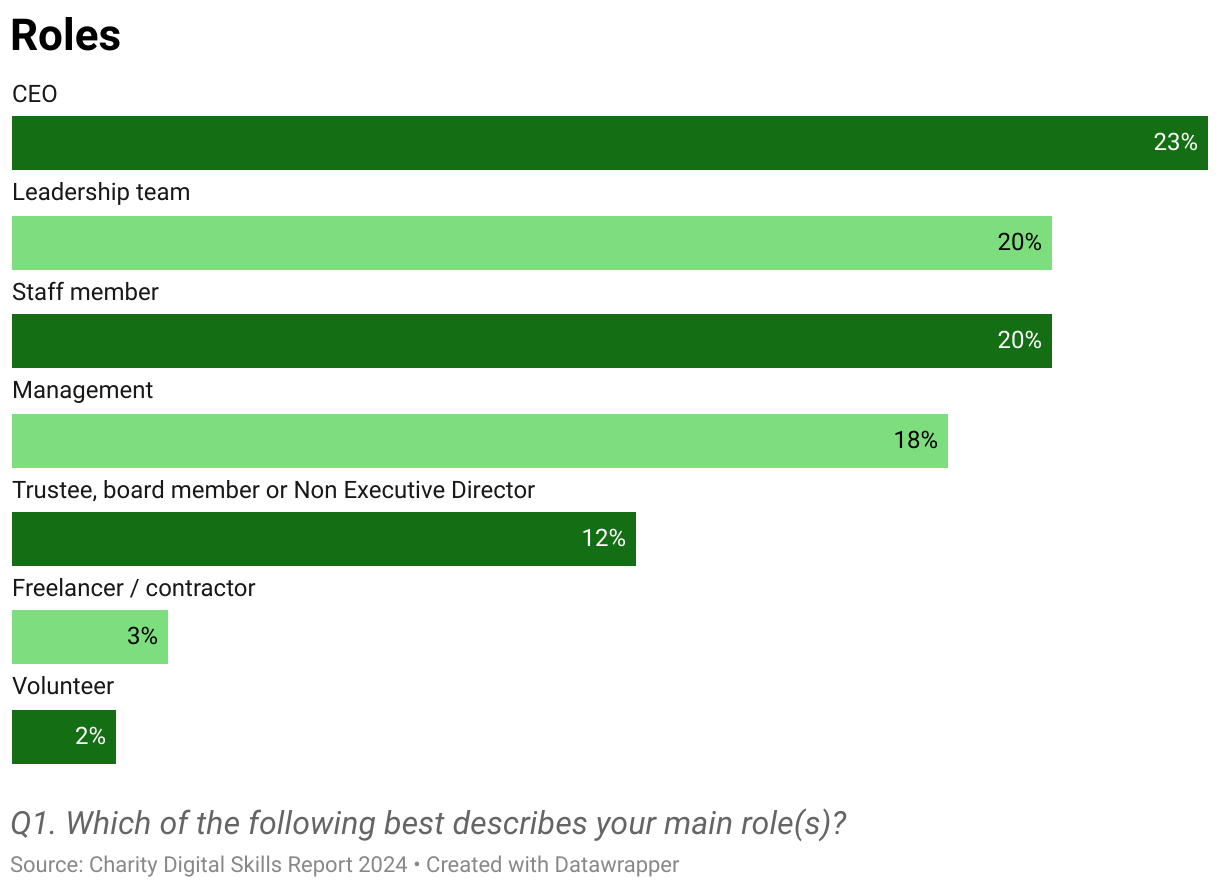
- Roles: 70% are CEOs, leadership team or managers, whilst 15% are trustees.
Equality, diversity and inclusion in our sample
This year, we expanded the population groups we ask about in the survey. We outline our approach, terms and rationale surrounding equality, diversity and inclusion in this blog post. Our intention is, first, to understand who we are reaching and whose voices are represented in the survey. Second, we examine any differences in digital priorities, barriers, funding and support needs across each different group and highlight these throughout the report.
We provide detailed insights in the report (see the section on Equality, Diversity and Inclusion) for organisations led by specific groups, where we have achieved 45 responses. This year includes organisations led by older people, black groups, neurodivergent people, disabled or d/Deaf people and LGBTQIA+ people. The intention is to inform funding, support, research and campaigns that tackle structural inequality, institutional racism and sexism in the sector, which have led to chronic underfunding for specific groups.
Main target groups represented
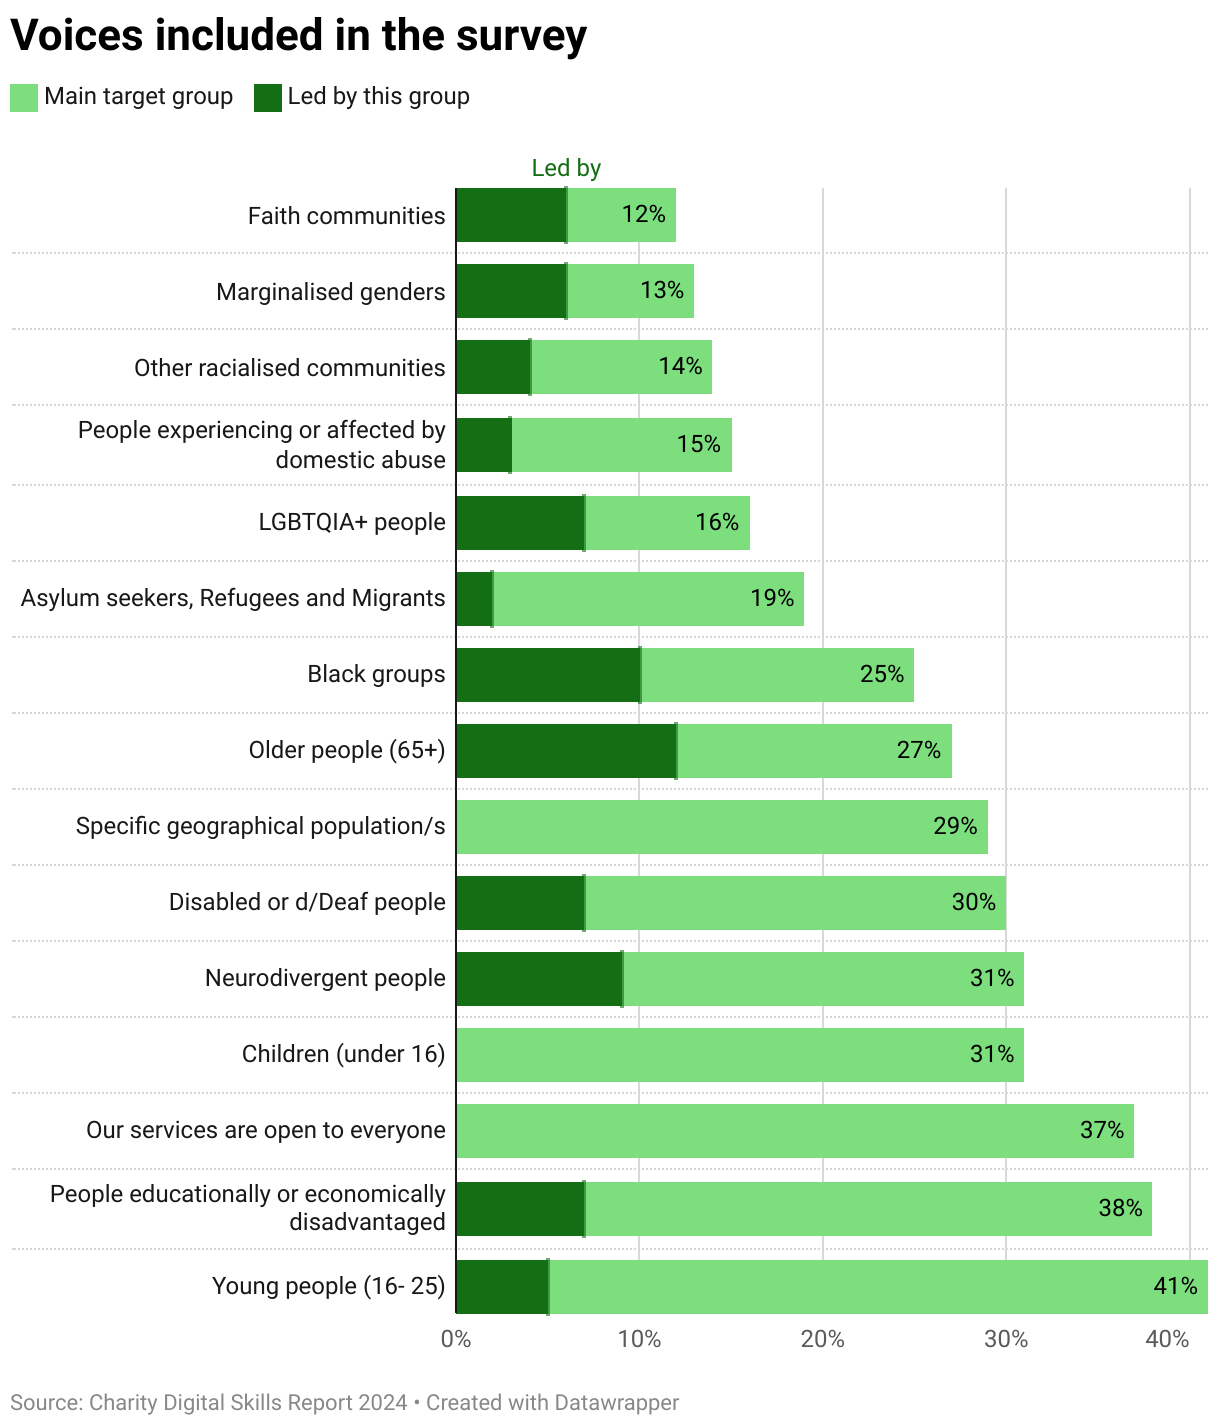
We asked respondents to identify their main target population groups. We have a very strong representation (over 100 responses) of organisations working with:
- Young people
- People who are educationally or economically disadvantaged
- Neurodivergent people (including those with cognitive differences, learning disabilities and learning difficulties)
- Children (under 16)
- Disabled or d/Deaf people
- Specific geographical population/s (e.g. residents in a town)
- Older people (65+)
- Black groups (Black African/Black Caribbean/Black British/Black Mixed/Black Other)
- Asylum seekers, refugees and migrants
- LGBTQIA+ people
Charities typically select four groups to describe who they are working with (and often more). This means that there is a significant overlap between the charities working with each target group. As a result, our analysis discovered very few differences between responses for each target group and the overall responses. For this reason, we do not provide a detailed breakdown of responses for each target group.
Organisations led by specific groups
We asked respondents if their organisation is led by specific population groups, with at least 75% of their board and 50% of senior management identifying with that group. Organisations led by the following groups have at least 30 responses:
- Older people (65+): 74 responses (12%)
- Black groups (Black African/Black Caribbean/Black British/Black Mixed/Black Other): 61 responses (10%)
- Neurodivergent people (including those with cognitive differences, learning disabilities and learning difficulties): 55 responses (9%)
- Disabled or d/Deaf people: 45 responses (7%)
- LGBTQIA+ people: 45 responses (7%)
- People who are educationally or economically disadvantaged: 44 responses (7%)
- Faith communities: 36 responses (6%)
- Marginalised genders: 36 responses (6%)
- Young people (16-25): 31 responses (5%)
We have less than 30 responses from organisations led by asylum seekers, refugees and migrants, people experiencing or affected by domestic abuse, and organisations led by other racialised communities. We will build on this in future reports and work in partnership with networks representing these groups.
UK nations and regions in our sample
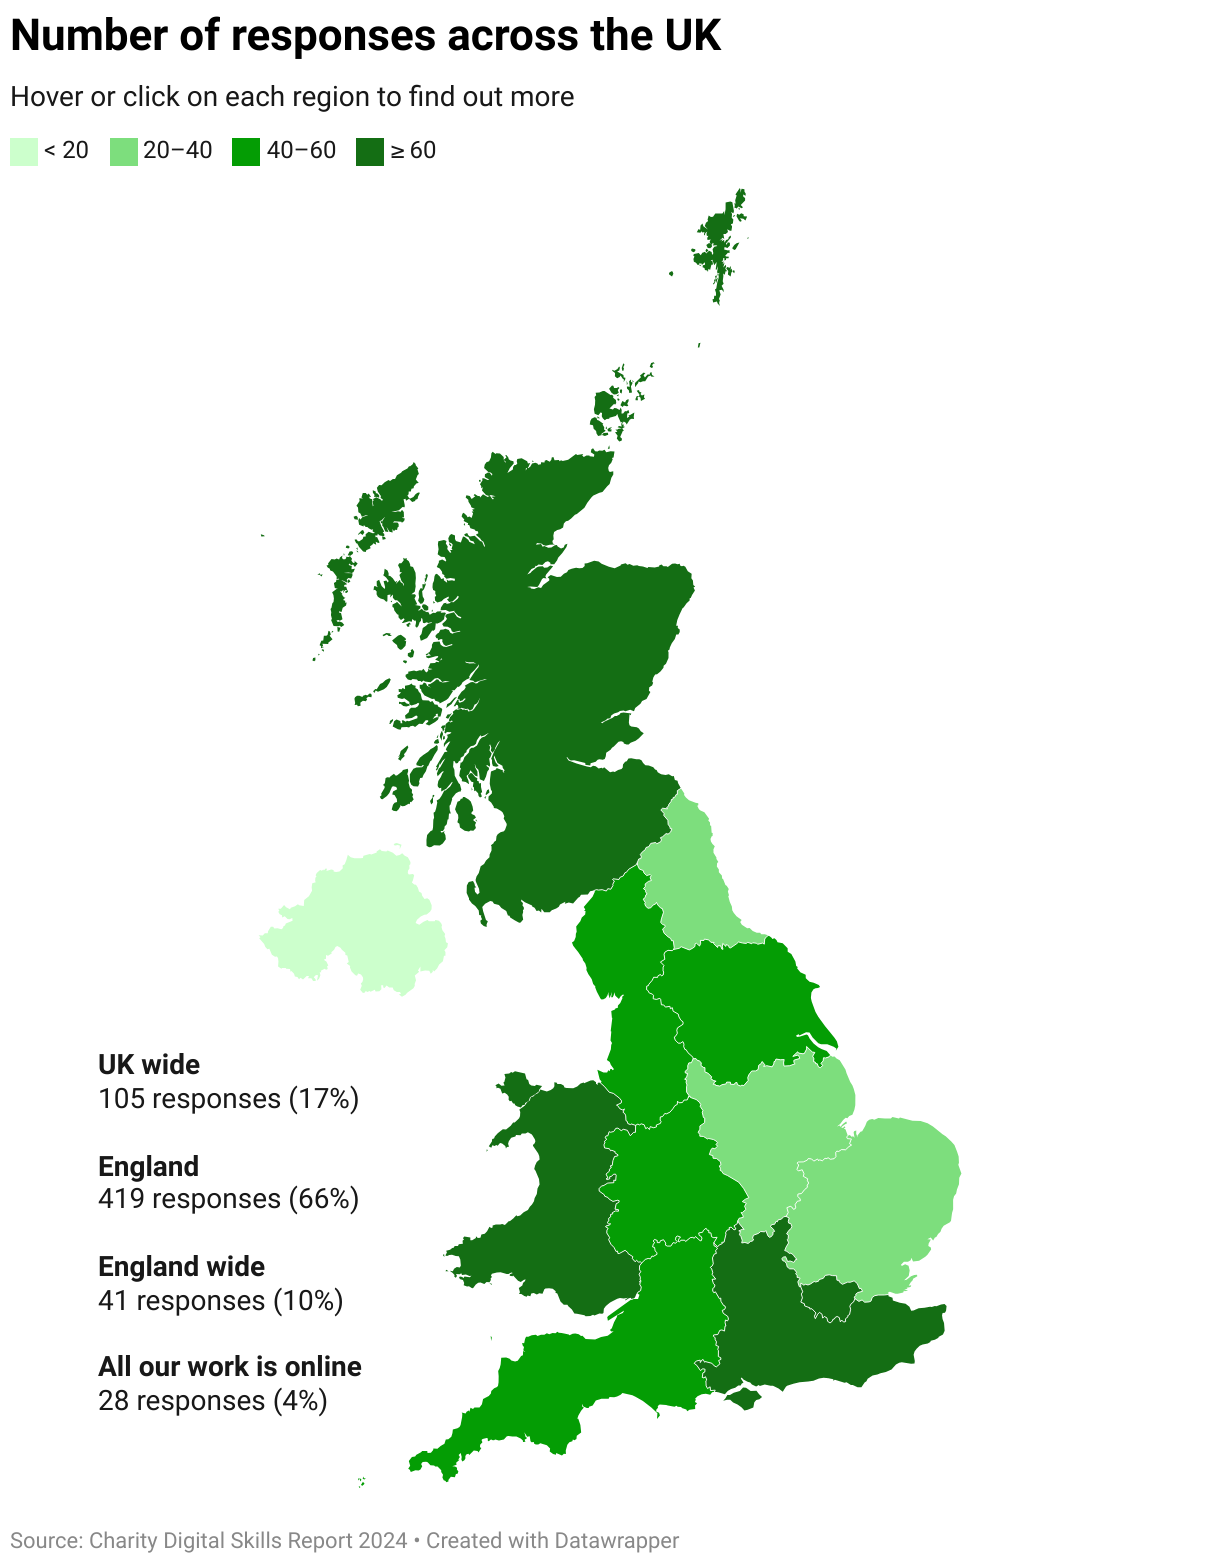
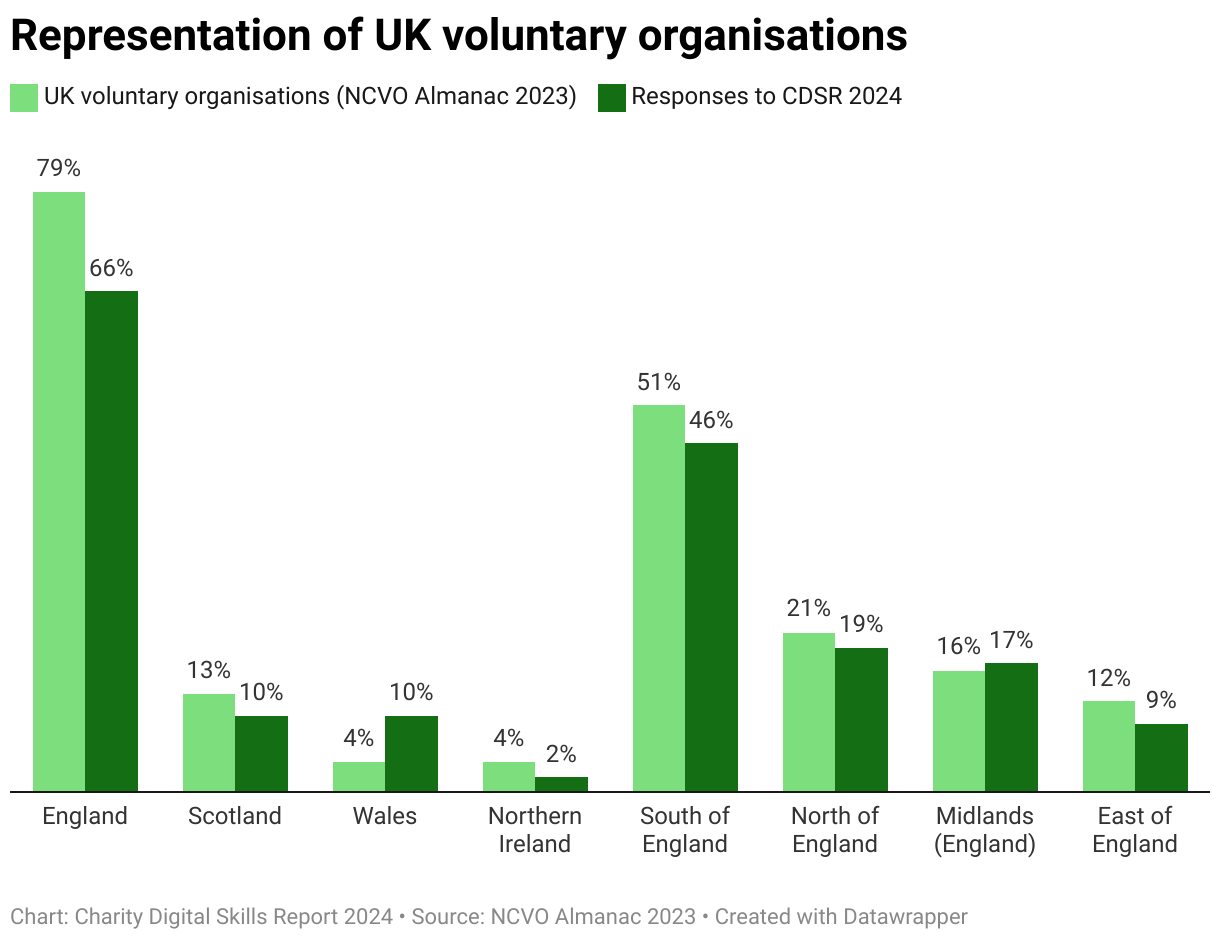
Responses mirror the distribution of UK charities. We have a good representation across the UK, but with a significant gap in Northern Ireland.
- Across the UK: Overall, we have a strong representation of responses from across the UK nations and England regions, apart from in Northern Ireland.
- UK wide: 105 charities (17%).
- Online: 28 charities (4%).
- England wide: 41 charities (10%).
- Wales: We have 62 responses from Wales, which is higher than the 42 in 2023. Large charities represent 48% of this group (higher than the 33% in the main sample), compared to 48% of small charities.
- Scotland: We have 64 responses from Scotland, which is higher than the 49 in 2023. Large charities represent 40% of this group (higher than the 33% in the main sample), compared to 51% of small charities.
- Northern Ireland: Only 14 responses are based in Northern Ireland.
- England: 419 charities are based in England, representing 66% of our sample. Of these, 64% are small and 31% are large (similar to the main sample).
- England representation: Our representation mirrors the locations of UK voluntary organisations, detailed in the NCVO Almanac 2023. For example, nearly half (46%) of our 419 responses working in England are based in the South. The NCVO Almanac similarly reports that over half (51%) of all English voluntary organisations are based in the South (South East, South West and London). However, see the data notes below for the differences in how these figures are calculated.
- England regions: We have a good representation of charities across England, with over 30 responses for every region in England. We have combined some regions to aid the analysis (noting that charities will work across multiple regions).
- Main sample: 635 charities, of which 62% are small and 33% are large.
- London (77 responses): 68% are small (slightly higher than main sample).
- Midlands (76 responses): Combining West Midlands (45) and East Midlands (31). 59% are small (slightly lower than the main sample).
- South (171 responses): Combining East of England (38), South West (54), South East (79). 72% are small (much higher than the main sample).
- North (129 responses): North West (54), Yorkshire and the Humber (44), North East (31). A slightly smaller proportion of 55% are small.
Geographical location data notes
- Where charities deliver their work across the UK, across England or entirely online, they were not asked to specify a further geographical focus (in our previous surveys they ticked all countries or regions).
- Throughout this report, you will see that size plays a crucial role in digital capacity and the responses given. The proportion of large and small charities varies significantly in each region or country and in comparison to our main sample. For this reason, any comparisons between regions should be made with care and also take size into account.
- The NCVO Almanac looks at where organisations are based, using Charity Commission data for main office location. In comparison, we asked respondents to think about where their work is delivered and they could specify multiple regions. They only needed to answer this question if their work had a geographical focus
Our definitions
Digital
We ask about digital in a holistic way. We cover specific digital skills and tools, IT systems, data and digital services. We also include general digital culture, attitudes, understanding and ways of working, including at board and CEO level.
Size
- Small charities: Respondents specifying an annual turnover of up to £1 million.
- Large charities: Respondents specifying an annual turnover of £1 million or more.
Digital stage
We asked charities to select which stage of digital development was the best fit for them from the following statements. We found a clear relationship between digital stage and digital skills responses, showing these stages are relevant and meaningful.
- Curious: We have some digital basics in place, such as social media or remote working, and recognise we could do more.
- Starting out: We’re developing our use of digital across the organisation but we don’t have a strategy in place yet.
- Advanced: Digital is integral to our organisational strategy and embedded in everything we do.
- Advancing: Digital is part of our strategy, but we’ve not embedded this yet. We’re investing in technology and developing our skills.
Charities
We use the term ‘charity’ in this report as shorthand to refer to the range of nonprofit and social sector organisations completing the survey, rather than to refer solely to registered charities (which make up 81% of respondents).
Rounding data
All survey data was rounded up or down to the nearest whole number. Percentages may not total 100 due to this process.
Overview of survey respondents
Types of organisation
- 81% are registered charities
- 17% are a social enterprise or community business
- 7% are a grantmaking trust or foundation
- 9% are an infrastructure/second tier organisation
- 53% provide frontline services